
At the end of July 2025, we released Pollen Wise version 5 to the public. This update came after months of work building a new forecasting data pipeline and utilized different data presentation formats. As this new forecasting pipeline introduced a different set of costs to operating Pollen Wise, we took the opportunity to re-evaluate our offerings across the basic (free) tiers and paid subscription tiers.
As a small team, we were excited about the new forecasting and data presentation! But the launch did not go as smoothly as we had hoped. Some users found the new line charts confusing. Other users were unhappy about previously available features being taken away. One of the major new features - Seasonality - was delayed at launch due to some performance issues on our servers.
Shortly after the launch, I posted an update on our blog - Pollen Wise 5 and Our Commitment to You. In reviewing all of the feedback, there were a couple of common complaints:
- Data presentations were confusing. We missed the mark on showing how our data is different from the rest.
- The basic (free) tier did not match offerings from competing seasonal allergy apps.
We went right to work addressing both of these concerns.
What makes Pollen Wise special
The “Too Long; Didn’t Read” version: v5 uses data generated by an entire network of proprietary sensors and environmental data to provide hourly forecasts to generate a daily High/Low/Average. Read below for the full version!
We hinted at what makes the data in Pollen Wise special in our last blog post but didn’t dive deep into what that means exactly - until today!.. Pollen Wise is a seasonal allergy companion app developed by Pollen Sense. All data presented in the app comes from a network of proprietary sensors operated by Pollen Sense and partner institutions (both public and private). These sensors are the world's first real-time automated airborne particulate sensors of their kind. They take advantage of advanced AI models trained on human-readable images of airborne particulates. These models work similarly to facial recognition, but instead of recognizing faces, they recognize the pollens, molds, and dust that you breathe daily!
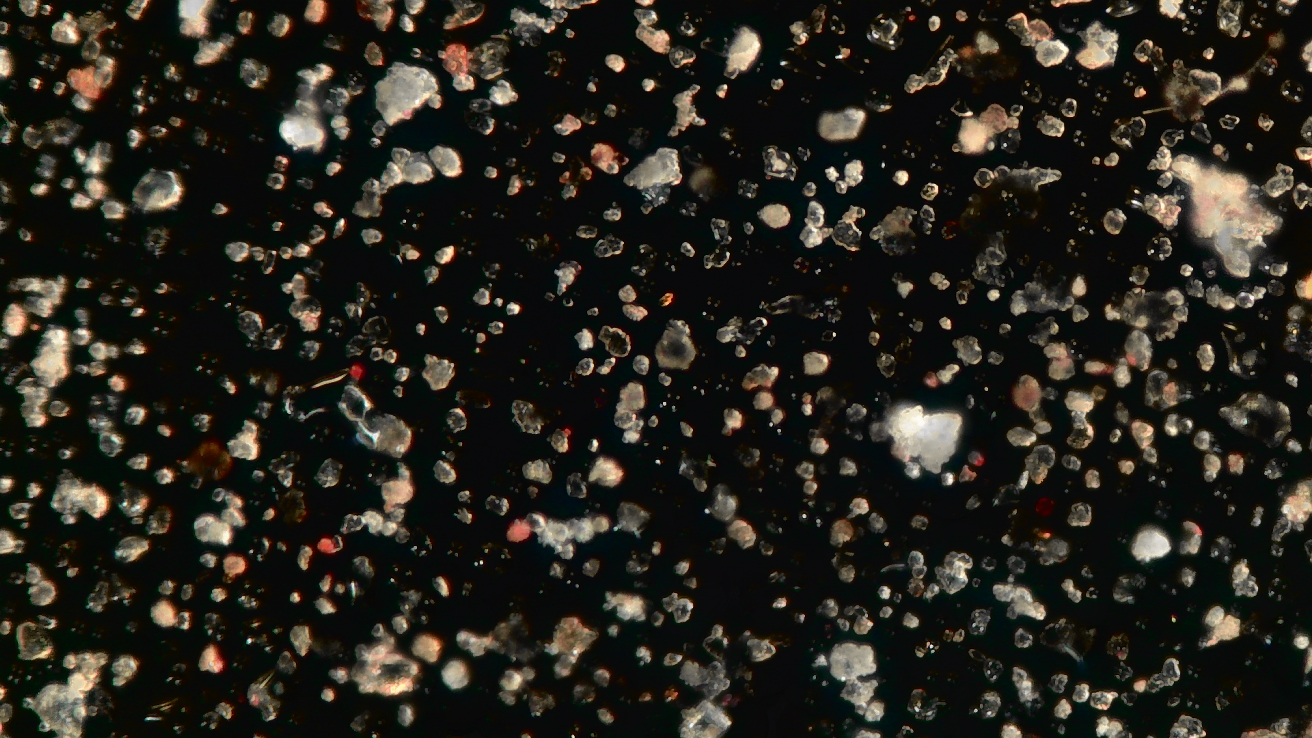
This is in stark contrast to the traditional ground-truth based seasonal allergy sources, which are done with traditional counting methods using manual counters and microscope slides. The problem with this method is you only get a “one time glance” at what is in the air. The process is time-consuming and lacks hourly data. Using AI allows us to continuously sample and aggregate PPM3 (particles per cubic meter) concentrations continuously.
Of course, there is room to improve on our industry-leading seasonal allergy data! Hourly data is new in this space, and we’re working hard on making sure our data is digestible in a space used to a single daily count. This includes monitoring any differences in what our Normalized Misery Index scale reports when comparing to other data sources (and our own raw concentration counts)
For those of you curious: v4 and earlier utilized a basic forecast, based solely on sensor data from the nearest monitoring site. Thus, scheduled or unscheduled maintenance time on a monitoring site would cause the app to “hop” to the next closest site which may have been much further away!
Better Data Layouts to show why Pollen Wise is special!
In reviewing the designs for v5, it became immediately apparent that our differentiators of daily highs and lows were not immediately apparent. So, we’ve created a new layout that brings even more information density (and readability!) right as you land in the app.
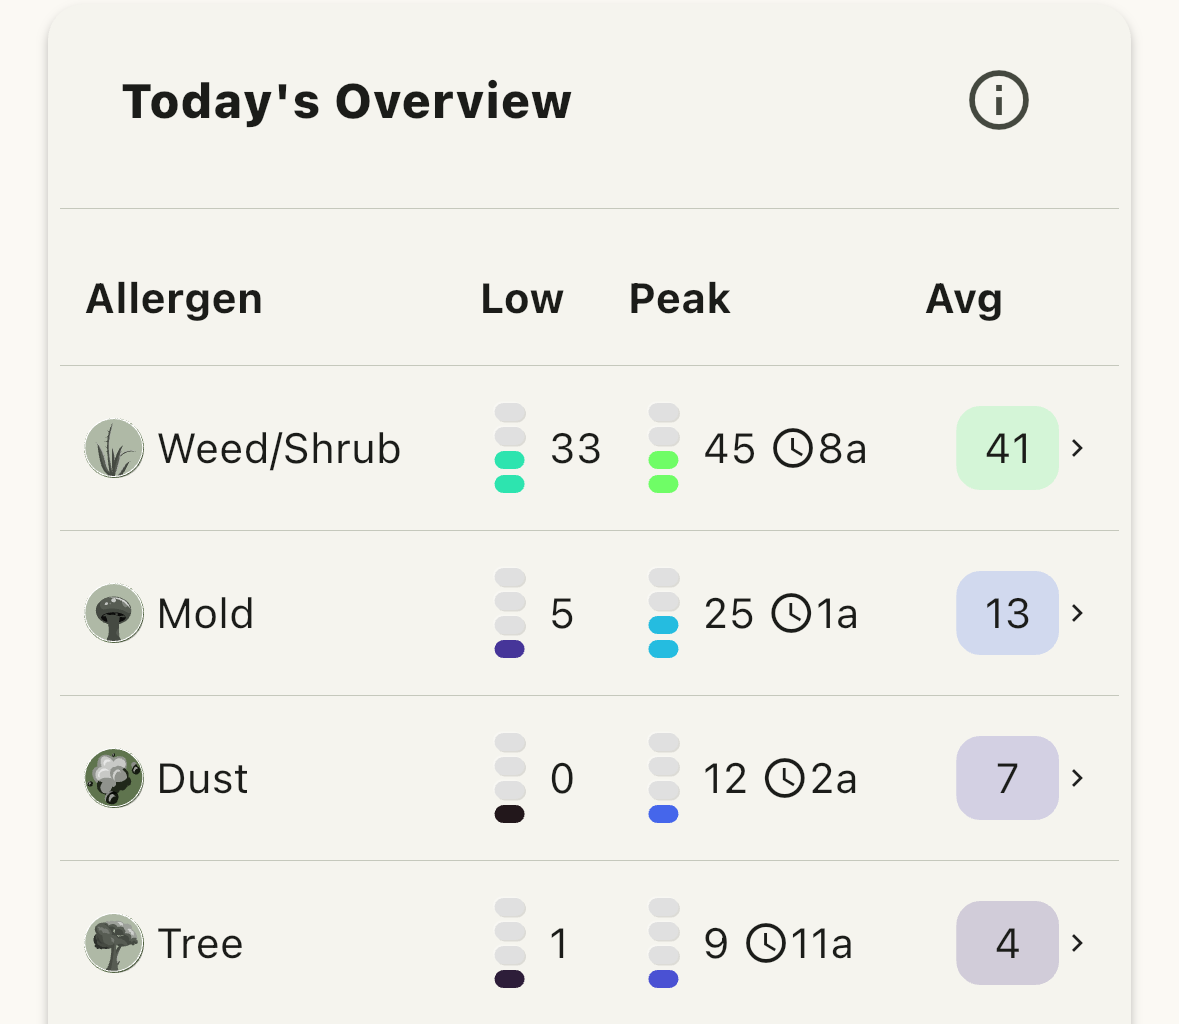
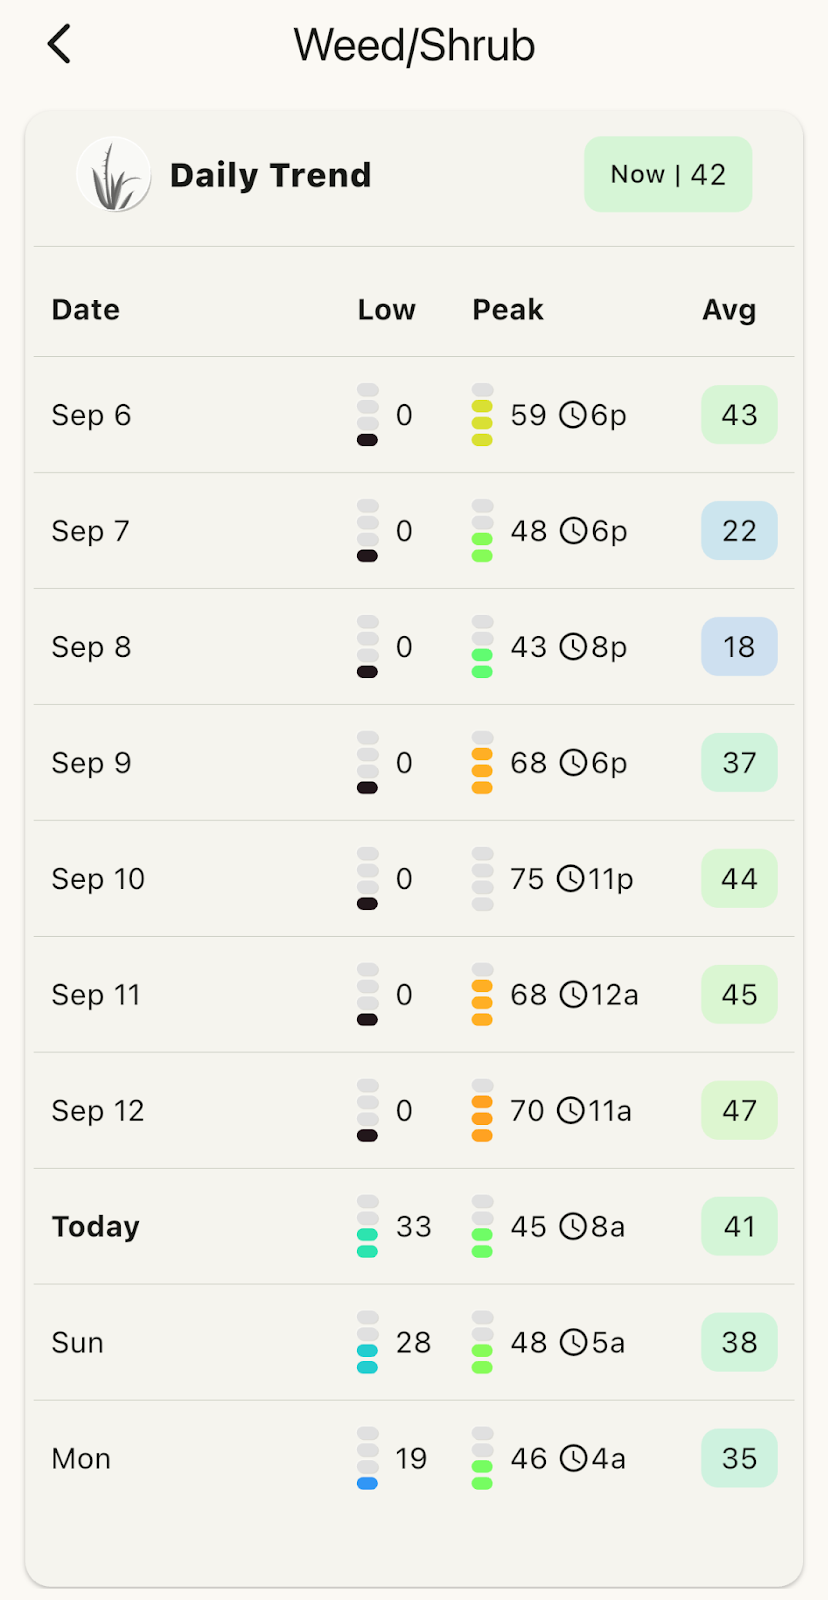
Tapping on any allergen allows you to dive deeper and see the multi-day forecast. For Plus/Elite users, we’ve also brought back the fan-favorite hourly forecast bars!
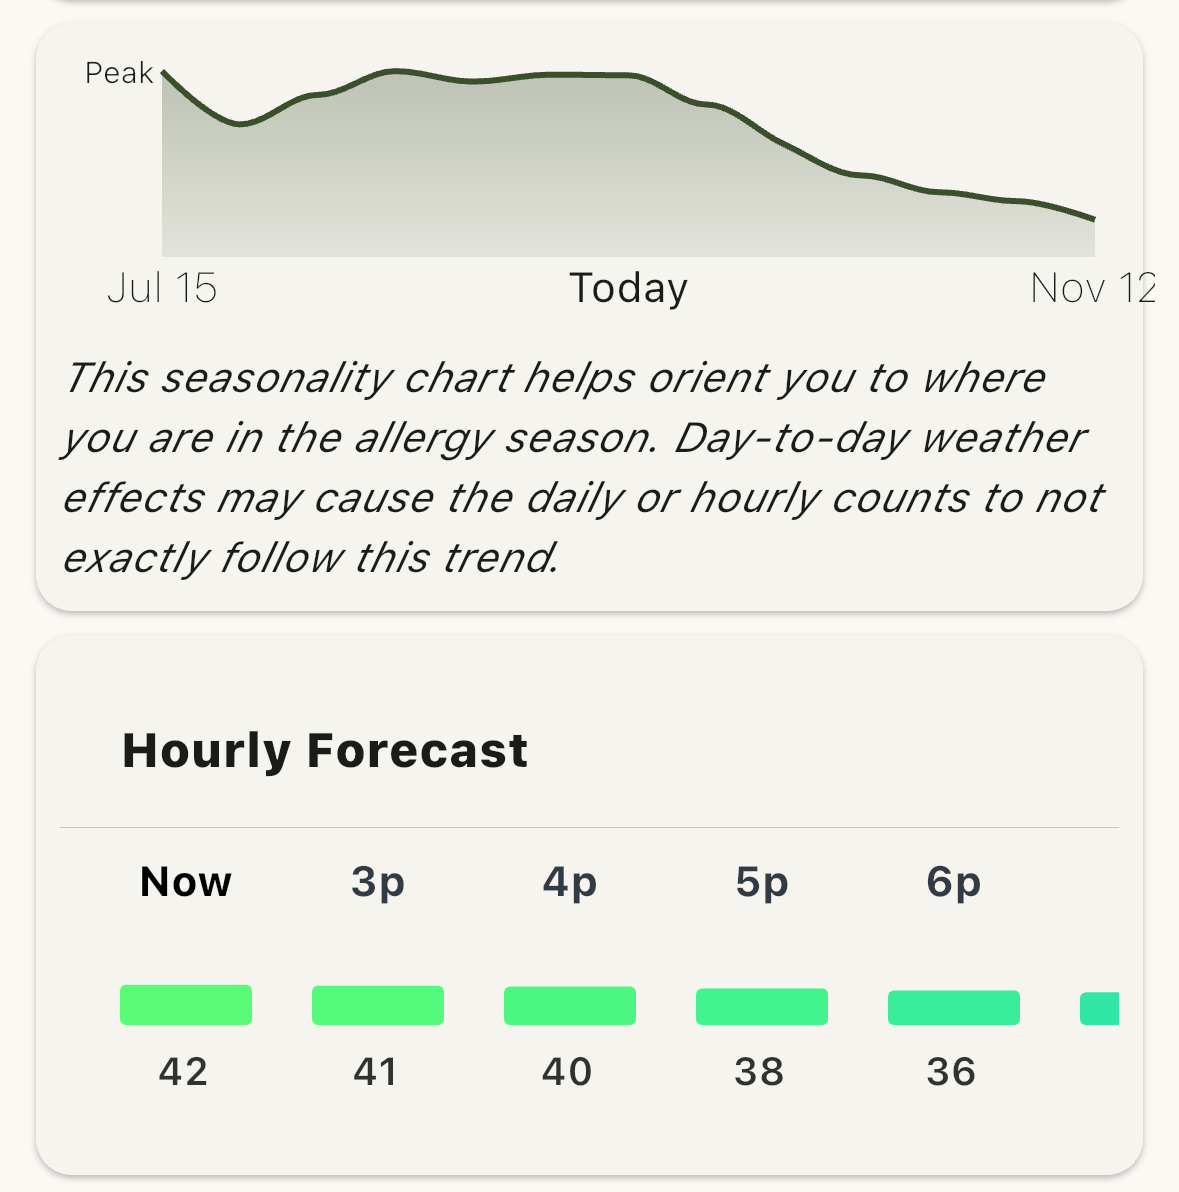
A note on color: to make sure that we’re color blind friendly, we’ve adopted Google’s turbo color scheme and have used it both for the heatmaps as well as colored severity indicators all around Pollen Wise! Thus, blues are on the low end, greener in the middle, and orange/reds on the high end.
Enhancing our free experience
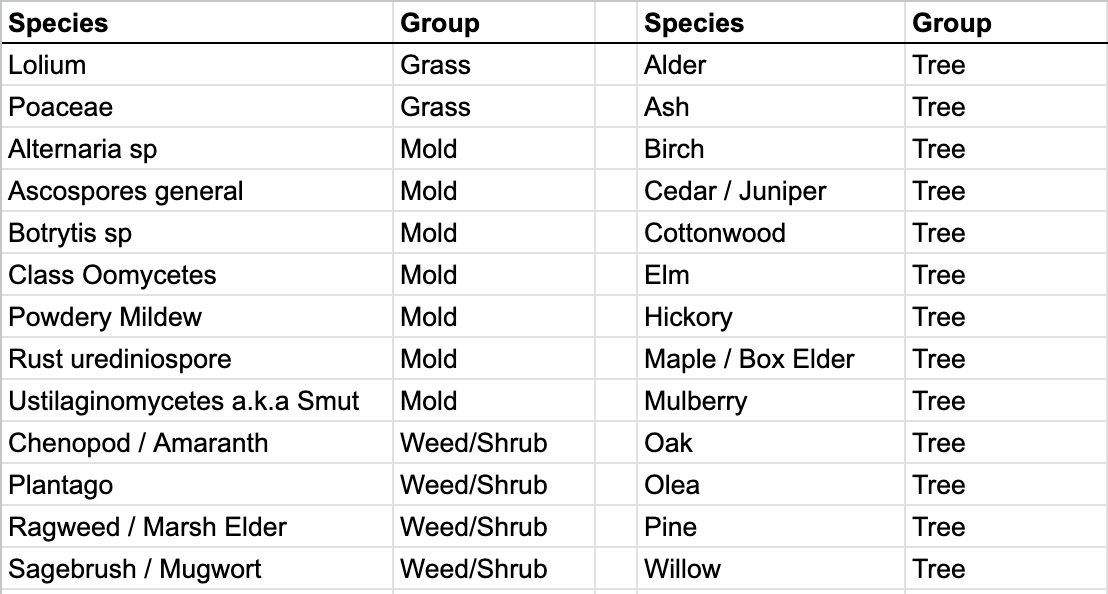
The second largest piece of feedback we received was in regards to our basic (free) tier. We definitely missed the mark by putting species-level data exclusively behind paid tiers. After reviewing feedback, we’re making some adjustments. We’ve added daily averages back for all 30+ allergens for users when logged into a free Pollen Wise account (we offer traditional email as well as Sign in with Google/Apple). With this account, you can customize the exact allergens you care about, as well as log entries into your allergen journal. We’ll be adding more and more account-based features in the future so stay tuned!
For the allergen families - Tree, Weed, Grass, Mold, and Dust - all users will have access to our unique Daily High and Low, powered by our AI sensor network. The daily high (peak) time will also be available to all users to help plan your day. If you’re interested in seeing the low time, let us know via in-app feedback!
Wrap Up
Pollen Wise v5.5 launches today with the improved data views shown in photos above. Over the last month and a half, we have done at least one app update a week as we address various bugs and issues from moving to the new data pipeline and the under-the-hood improvements.
As the sole developer and product manager of Pollen Wise, I’ve spent many hours combing through every last feedback, bug report, and app/play store review that we received since the launch of version 5 in late July. I want to thank the rest of the Pollen Sense team for their support in investigating data anomalies and responding to support tickets. I’d also like to thank some generous users who donated their time over the last month to bounce some ideas off of as we worked tirelessly to address Pollen Wise’s biggest shortcomings.
We’re a small but passionate team of software developers, engineers, and aerobiologists here at Pollen Sense. There’s so much more in store for Pollen Wise as we start looking towards 2026, so stay tuned!
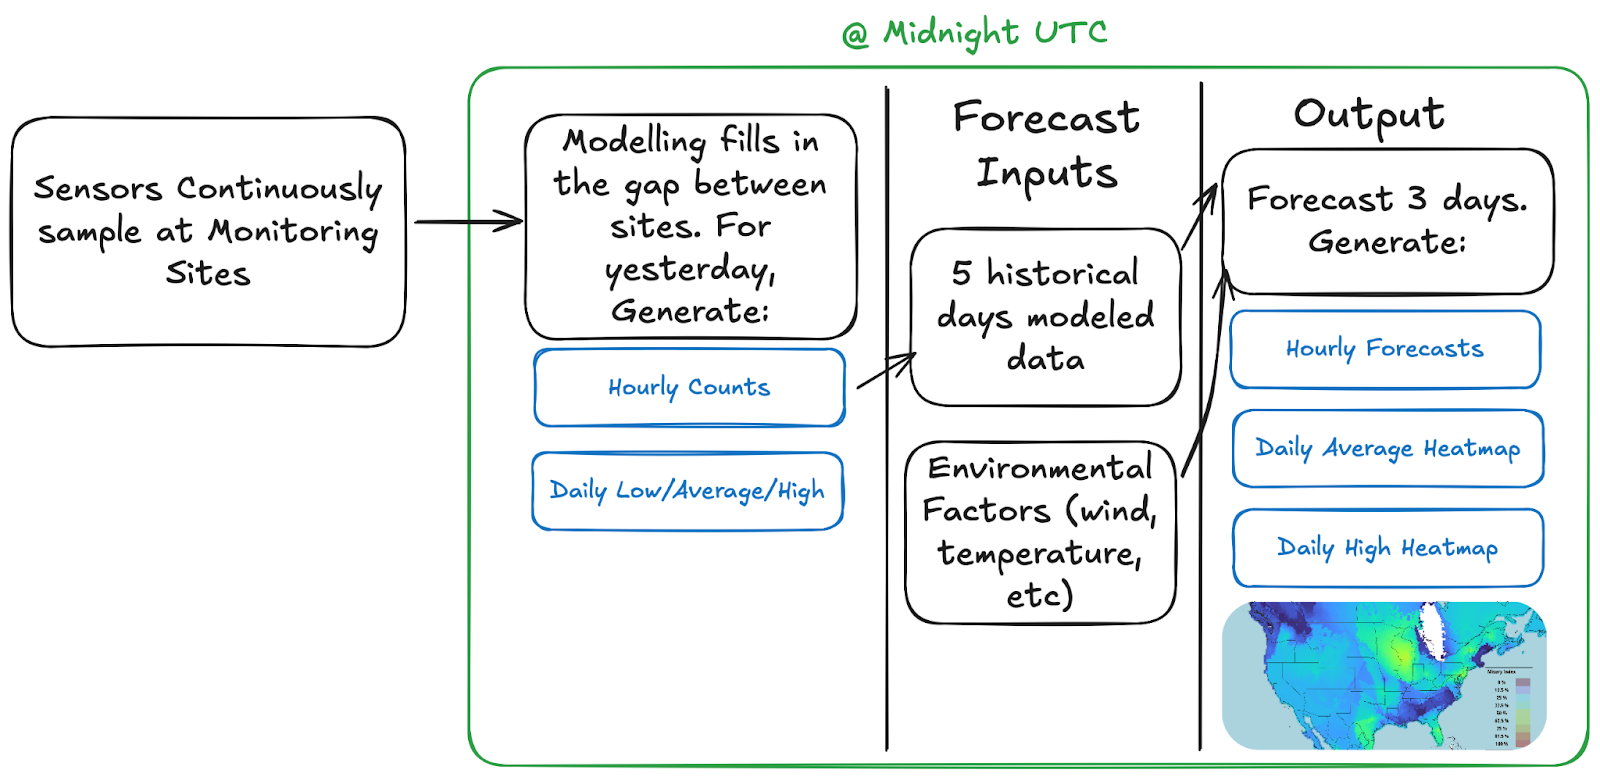
v5 uses a vastly higher number of data inputs compared to v4 (and earlier), most notably the entire monitoring network combined with various important environmental factors. Because of our unique hourly counting, Pollen Wise is able to offer Daily Highs and Lows in addition to the traditional averages! Hourly counts also provide us with another unique opportunity: communicating when a given allergen will be peaking for the day, so that all users can more effectively plan their outdoor activities! The data pipeline is as follows: The data provided in Pollen Wise (and this blog post) is for general informational purposes only and is not intended as a substitute for professional medical advice, diagnosis, or treatment. Always seek the advice of your physician or other qualified health provider with any questions you may have regarding a medical condition. Never disregard professional medical advice or delay seeking it because of something you have read here.